


Recrystallization in ultra-fine grain structures of aluminium alloys processed by severe plastic deformation
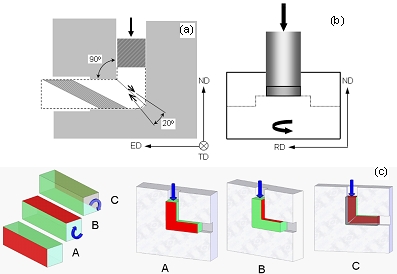
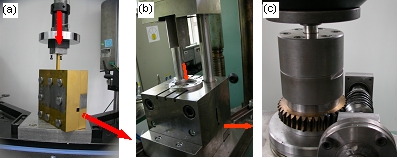
Severe plastic deformation (SPD) is very often used for the improvement of strength properties of aluminium alloys by converting the conventional coarse-grained metals into ultra-fine grained materials. Equal channel angular pressing (ECAP) and high torsion pressure (HPT) are the variants of SPD methods. ECAP involves the use of a die that contains two intersecting channels of an equal cross section, whereas HPT is the method in which the material undergoes torsion, in a closed die, under high pressure (Fig. 1). In both deformation modes, intense shearing of the material takes place, and it leads to a strong grain refinement.
ECAP has the advantage of producing relatively large samples. This provides the possibility to manufacture the required material at the industrial level and also has the potential for commercialization. It was frequently reported in the past that four processing routes could be used in ECAP. Their application leads to different structures and a different degree of the grain refinement.
- In route A, the specimen is pressed without rotation.
- In route BA, the specimen is rotated (around the extrusion direction (ED)) by 90o in alternate directions between the consecutive passes, whereas
- in route BC the specimens are rotated by 90o counterclockwise between each pass.
- In route C, the specimens are rotated by 180o between each pass.
In the case of the material processed through route A, the flat dislocation arrangements have a tendency to align along the ED-TD plane, where TD is the transverse direction. Route BC, in fact, describes the re-orientation of the dislocation microstructures around ED, superimposed upon the rotation around TD, due to the shear plane inclination effect. This should therefore lead to the desired nearly equiaxed structure. In the case of route C, the shear plane and the shear reversal effects combine. The properties of the deformed samples depend on the pass number, the applied deformation route and also the microstructural variables associated with the initial material. In particular, the combined effects of the small dispersoids and the large particles on the microstructure development are in the centre of interest. In the two phase alloys containing second phase particles (SPP), the diameter, the shape and the uniform or non-uniform distribution of the particles are crucial for the dislocation structure development and the determination of the processing ability of the material.
When investigating the properties of the samples subjected to HPT, it is important to note that the central region of the disk is usually not refined to the same extent as the outer region. However, as the number of turns is increased, the inhomogeneity associated with the decrease of strength in the central region is gradually removed and the values of microhardness are reasonably similar just after a total of 5 turns [3]. The hardness increases significantly after 1 turn of HPT and this effect is comparable to the increase in strength of the aluminum-based alloys after processing through one pass in ECAP [1].
In the materials containing second phase particles processed by ECAP or HPT, the shear deformation effects are particularly large in the areas of the matrix close to the coarse particles. This should quickly lead to the desired ultra fine-grained structures. However, from the practical point of view, it is important that the refined microstructures should remain reasonably refined after the heating to the temperature of further plastic shaping. Thus, the resistance to coarsening is the crucial factor that decides about the applicability of extremely refined structures [3]. Other problems are related to the textural changes after heating.
The analysis of the microstructure stability and the textural changes at the very early stages of recrystallization of highly deformed Al-alloys is usually difficult to perform, due to the high defect content, especially close to the large SPP. In some cases, the possibility of application of the system based on scanning electron microscopy (SEM) is limited and the obtained information on the distribution of the dislocation boundaries is not complete. Very often, important details of the dislocation structures are lost when compared to the bright field images received from the transmission electron microscopy (TEM). There are also other problems with the use of the systems based on SEM, e.g. those related to the lack of possibility of a continuous observation of the changes that occur within the dislocation structure. This is particularly important in the case of the structural and textural changes at the very early stages of recrystallization. In that case, most of the microstructural units are usually too small to be analyzed by SEM/EBSD. Therefore, an application of the system with the spatial resolution better than ~50nm and the angular resolution better than ~1o (typical values for a high resolution SEMFEG/EBSD) is critically needed. One of the ways to solve the problem is the application of the TEM-based orientation imaging system, which is able, better than SEM/EBSD, to correlate the changes in the dislocation structure with the crystal lattice rotations [4-12].
In earlier investigations by Zaefferer et al. [4] the method of the systematic local orientation measurements in TEM was successively applied to study the nucleation mechanisms that led to the formation of the cube texture in heavily cold rolled Fe-36%Ni. Fundenberger et al. [6] applied the TEM orientation mapping for the microtexture analysis of the severely deformed aluminium, the lamellar polycrystalline two-phase TiAl alloy and the metastable chromium carbide. In a series work of Paul et al. [10-12], the system was used for a detailed study of the dislocation mechanisms responsible for the shear bands formation and their very fine nanostructure characterized by the specific texture components.
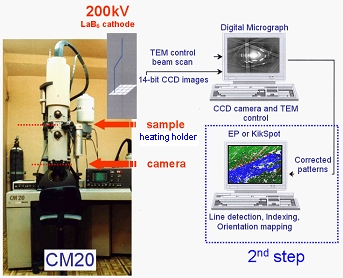
SEM and TEM orientation imaging systems are based on the same idea, i.e. a step-by-step scanning with the determination of the crystal orientation in each step. However, there are a number of dissimilarities mainly related to the hardware differences and to the specific features of the diffraction patterns [6]. A system for creating the orientation maps uses the TEM convergent beam Kikuchi patterns or a selected area of the diffraction patterns [7]. As for now, there is no fully automatic system for TEM analogous to that applied in SEM. In the previous own works, the system based on TEM was used for the explanation of the mechanisms of the shear band formation in the twinned face centered cubic (fcc) metals. In this work, the same system implemented at IMMS PAS in Krakow was applied for the analysis of the textural transformations during the in-situ recrystallization in TEM. A new approach to the analysis of the nucleation of highly dislocated structures was possible with the use of a combination of the in-situ heating and the orientation mapping in TEM. In particular, the high resolution orientation maps give information on the orientations of the fine grains that appeared at the very early stages of recrystallization in the highly deformed zones around the large SPP.
For the TEM in-situ experiments, a pronounced dependence of the recrystallization behavior on the specimen thickness is usually indicated, the question that still constitutes the problem in the direct comparison of the recrystallization in the bulk samples and those observed within the thin foils. The problem was first observed by Fujita et al. [13] and the explanation of this phenomenon can be given by the later considerations of Roberts and Lehtinen [14]. The conclusions resulting from these considerations are that the recrystallization front at the assumed temperature can move forward when the stored energy and the foil thickness are 'sufficiently large'. Hutchinson and Ray [15] showed that the minimum foil thickness for the recrystallization experiments is not only determined by the amount of the stored energy but also by the size of the cell structure itself. In the specimens with the cellular microstructure, the specimens' thickness should be at least equal to the thickness of the cells. This directly leads to the conclusion that the smaller the cell size, the smaller the thickness of the thin foils can be analyzed. This is a very important statement, leading to the subsequent conclusion that it is possible to apply a standard 200kV TEM to the in-situ recrystallization experiments when the material is extremely highly refined. An extremely strong microstructure refinement is possible, e.g. by the application of severe plastic deformation.

Nucleation of new grains analyzed in nano-scale.
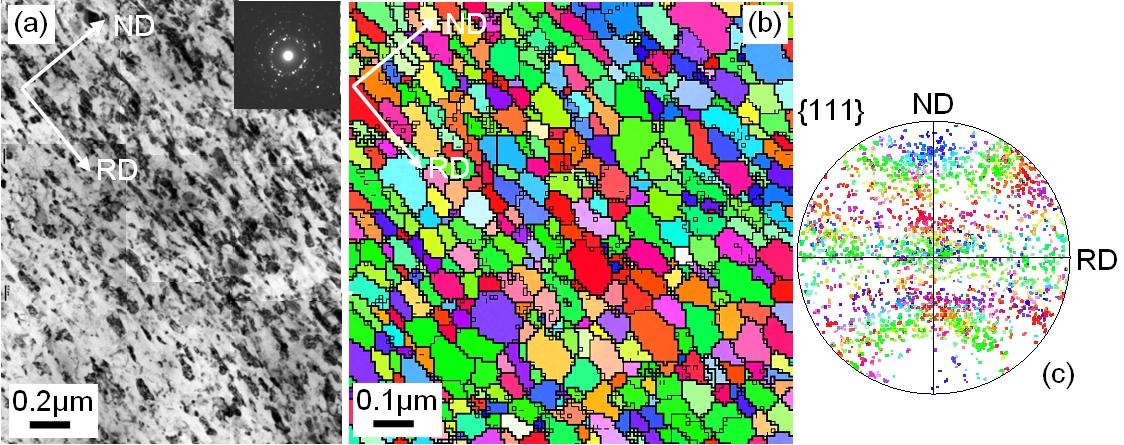
Figure 4a shows an example of a strongly recovered area far from the large SPP, observed in the ECAP-processed sample (C6x) and then annealed for 60s (in TEM) at the temperature that could be estimated to be about 350oC. The microstructure and the texture (Figs. 4b-c) well correspond to those observed in the deformed state. The strongly elongated shape of the subcells is still clearly visible; however, the cell interiors are free of dislocations. The corresponding orientation map, the misorientation line scan across the boundaries (||ND) (Fig. 4c), and the {111} pole figure (Fig. 4d) show that the clusters of the nano-layers are nearly complementarily oriented. For longer annealing times (e.g. for 120s), an abnormal growth of some subcells occurs in these places. The main characteristic feature of the texture development of the ECAP-processed samples is that the two complementarily oriented components are predominant and these orientations do not depend on the applied deformation route. For most of the observed cases, the external directions coincide very well with the particular crystallographic directions, i.e. ND||<111>, ED||<110> and TD||<112>. This is also clearly visible in Fig. 4d, for lightly annealed samples. In the present study, after short annealing, only a strictly limited set of primary nucleus orientations was detected. These are new small areas, with a diameter in the range of 100-400nm, characterized by uniform orientations, which could be described (in most of the observed cases) as resulting from the rotations around the axes <111>-<112>, with respect to the texture components characteristic for the deformed state.
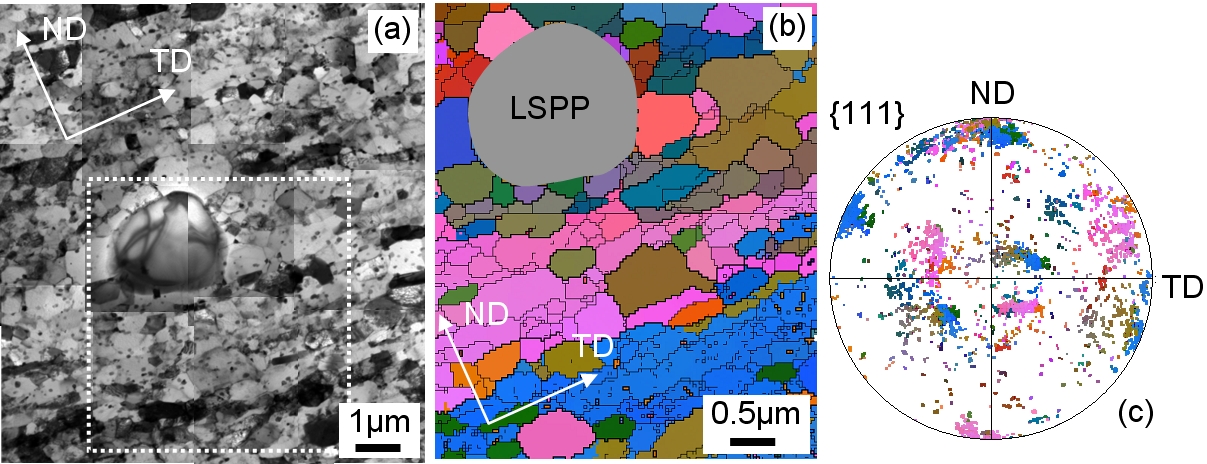
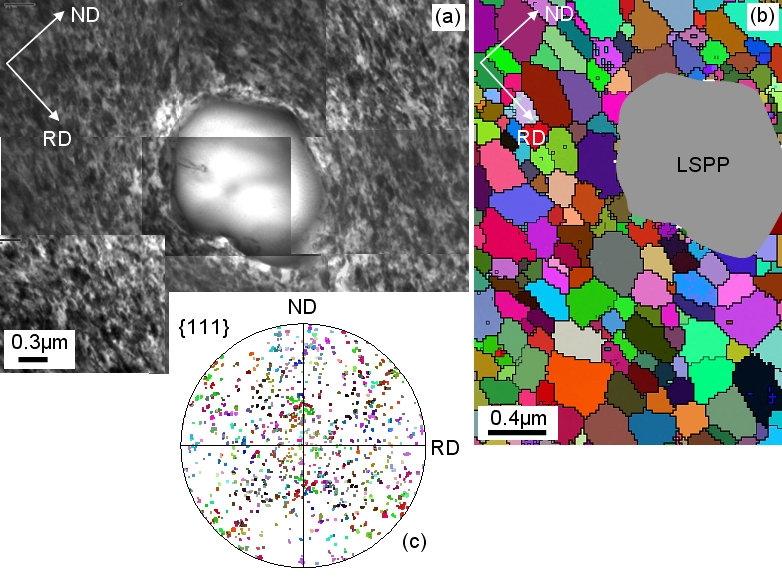
The orientation maps of the areas close to the large SPP were particularly interesting. It is well-know that the non-deformable large SPP strongly affect the deformation process with the occurrence of deformation zones around them. The TEM-based analysis of the microstructure and texture revealed that most of the nucleation events at the early stages of recrystallization could be attributed to these highly deformed regions close to the large SPP. Figure 5a shows the TEM bright field image of the fine grains developed in such an area; the sample was deformed in ECAP (6 passes through route C) and then lightly annealed at 350oC for 60s. The thin foils were prepared from the section perpendicular to the extension direction (ED). The area with the large SPP and the small recrystallized grains around it was analyzed by orientation mapping. The map is shown in Fig. 5b. The 2.5ľm x 3ľm image was obtained with the step size of 20nm. The map reflects the microstructure and texture of the new grains growing inside the highly deformed zone around LSPP (particle with diameter ~1.5ľm).
The orientations at the points constituting the map (in the recovered and the recrystallized areas) are represented in the {111} pole figure of Figure 5c. In most of the observed cases, the growth of the recrystallized grains occurred by the coalescence of the neighboring subcells. The process usually leads to a nearly homogeneous structure of equiaxed grains of a similar size. The size of the grains in the vicinity of the large SPP is only occasionally significantly greater than the average grain size. In all the analyzed cases, the TEM orientation mapping showed that the orientations of the new grains were not random and only strictly defined orientation families were observed.
However, the calculation of the exact misorientation relation is very often difficult, mainly because of the troubles with the determination of the microtexture components of the deformed state in the areas close to the particles. In the case of the HPT-processed samples, the microstructures obtained after short annealing were significantly more homogeneous, with very small grain diameters. This applies to the areas far from the particles, as well as those close to the large SPP, as shown in Figs. 6 and 7, respectively.
Summary
TEM is one of the most important tools for the studies of the microstructure and the orientation changes in nanoscale. It was shown that the application of the TEM based orientation mapping enables the orientation measurements of individual sub-cells, even in the severely deformed and then recovered or slightly annealed structures. This opens the possibility to describe the mechanisms responsible for the texture transformation in both the deformed and the recrystallized states. The system, which uses transmission Kikuchi patterns, ensures very high spatial resolutions and a high misorientation precision. However, the accuracy in the absolute orientation determination is limited by the sample preparation and the precision in positioning the sample in the TEM sample holder. It is difficult to obtain the accuracy better than a couple of degrees with the standard procedure for the sample preparation.References
- R.Z. Valiev, R.K. Ismagiliev, I.V. Alexandrov, Progress in Materials Science, 45 (2000), p. 103.
- R.Z. Valiev, T.G. Langdon, Progress in Materials Science, 51 (2006), p. 881.
- A. Zhilyaev, T.G. Langdon, Progress in Materials Science, 53 (2008), p. 893.
- S. Zaefferer, Applied Crystallography, 33 (2000), p. 10.
- S.C. Wang, M.J. Starink, Journal of Microscopy, 211 (2003), p. 130.
- J.J. Fundenberger, A. Morawiec, E. Bouzy, Solid State Phenomena, 105 (2005) 37.
- D.J. Dingley, M.M. Nowell, Microchimica Acta, 147 (2004), p. 157.
- J. Portillo, E.F. Rauch, S. Nicolopoulos, M. Gemmi, D. Bultreys, Materials Science Forum, 644 (2010), p. 1.
- M. Cabibbo, Materials Characterization, 61 (2010), p. 613.
- H. Paul, A. Morawiec, E.Bouzy, J.J. Funderberger, A.Pištkowski, Metallurgical and Materials Transaction A, 35A (2004), p. 3775.
- H. Paul, A. Morawiec, JH. Driver, E. Bouzy, International Journal of Plasticity, 25 (2009), p. 1588.
- H. Paul, Advanced Engineering Materials, 12, (2010), p. 1029.
- H. Fujita, Y. Kawasaki, E. Furubayashi, S. Kajiwara, T. Taoka, Jap. J. Appl. Phys. 6 (1967), p. 214.
- W. Roberts, B. Lehtinen, Phil. Mag. 29 (1974), p. 1431.
- W.B. Hutchinson, R.K. Ray, Phil. Mag. 28 (1973), p. 953.